Swiftlight is a powerful, easy-to-use project management software application used by a wide variety of organizations. It is simpler than many traditional Gantt chart software tools like Microsoft Project, and fantastic for high level planning and progress reporting.
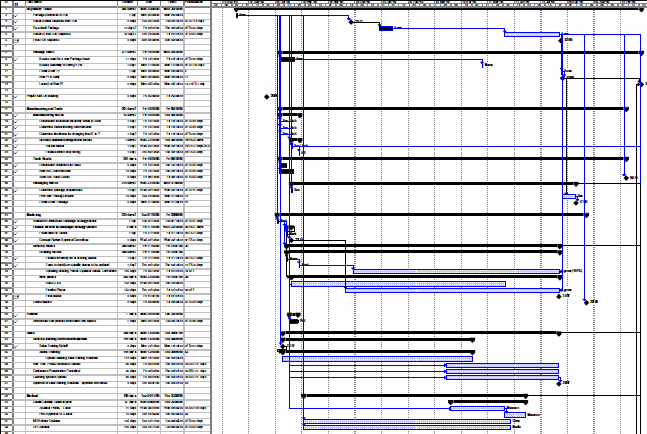
Comparison of Typical Gantt Chart Software Output vs. Swiftlight Timeline Output
How to Create a Swiftlight Timeline in 3 Minutes ->
Sign Up for a FREE 30 Day Trial —>
While traditional Gantt chart software helps you schedule the detail of a project, laying out task durations, inter-dependencies and more, there can be drawbacks:
On the other hand, Swiftlight lets you visualize, plan and communicate a project plan with ease. It helps you separate the high level information from the detail, provides one page timelines and project summaries that focus on the “big picture” and the outputs look great and export directly into PowerPoint for easy communication.
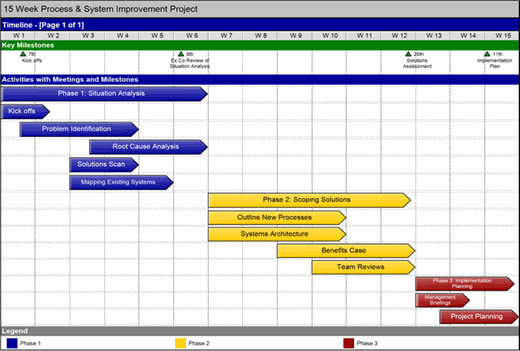
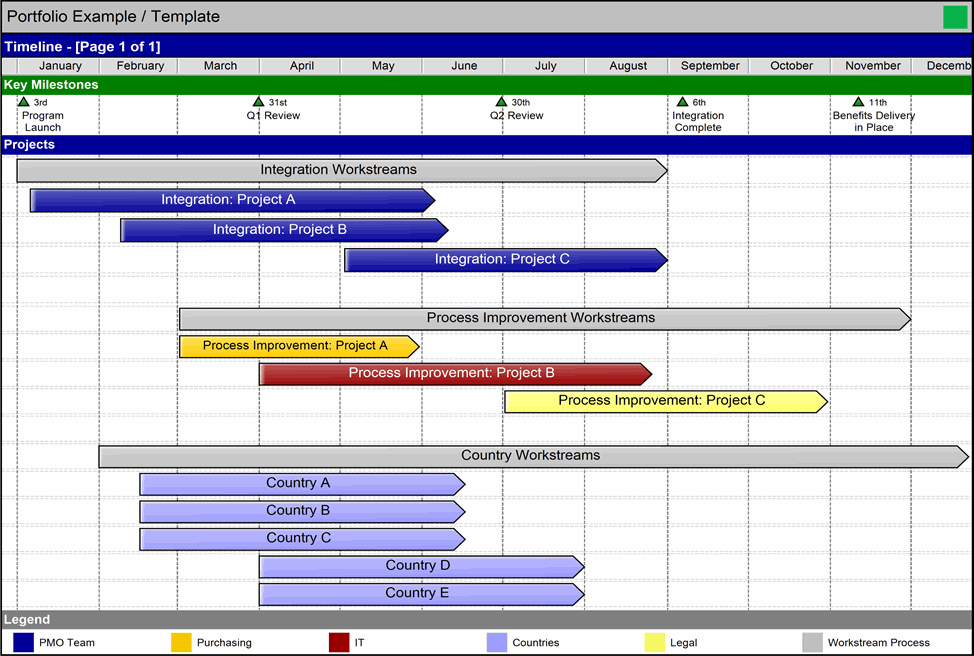
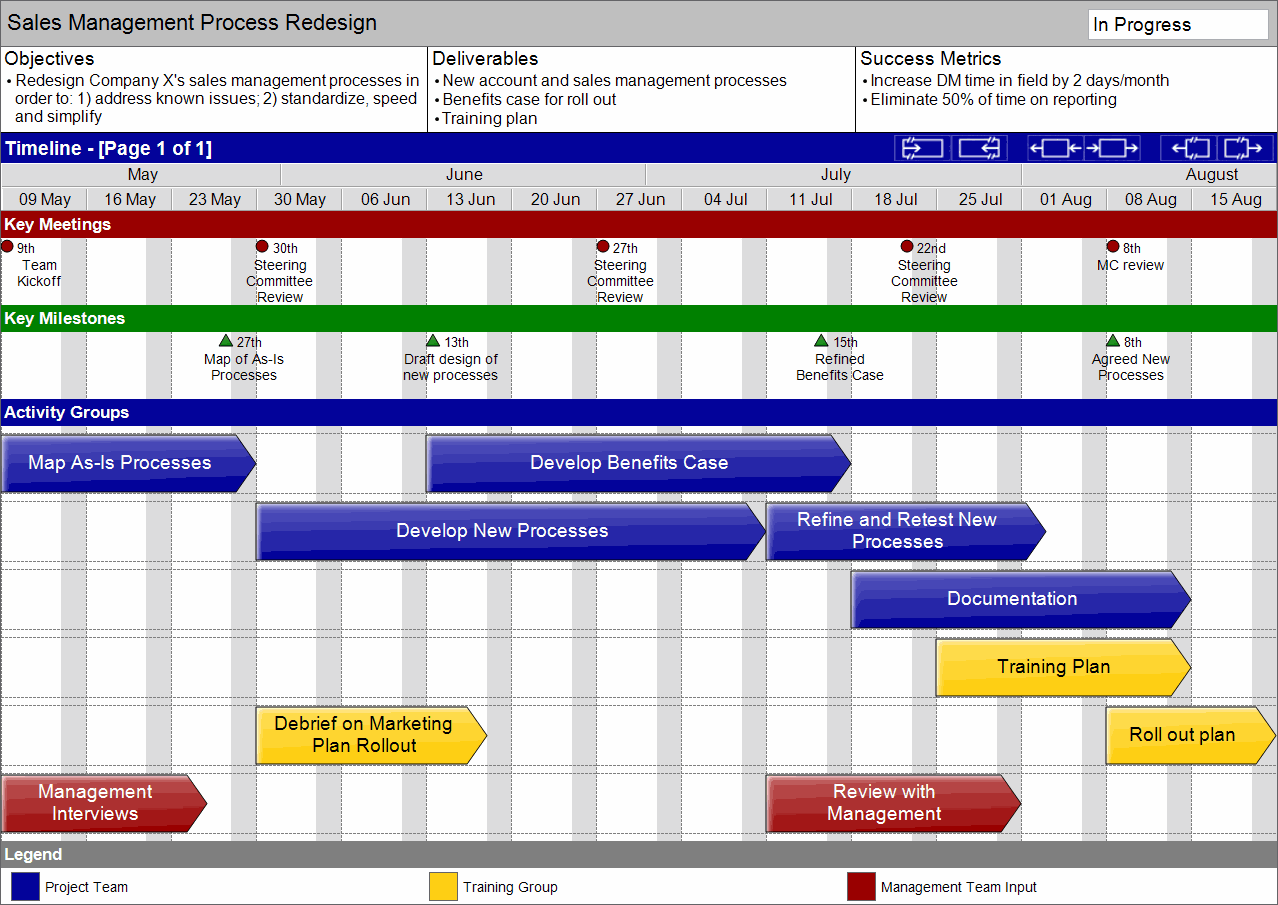
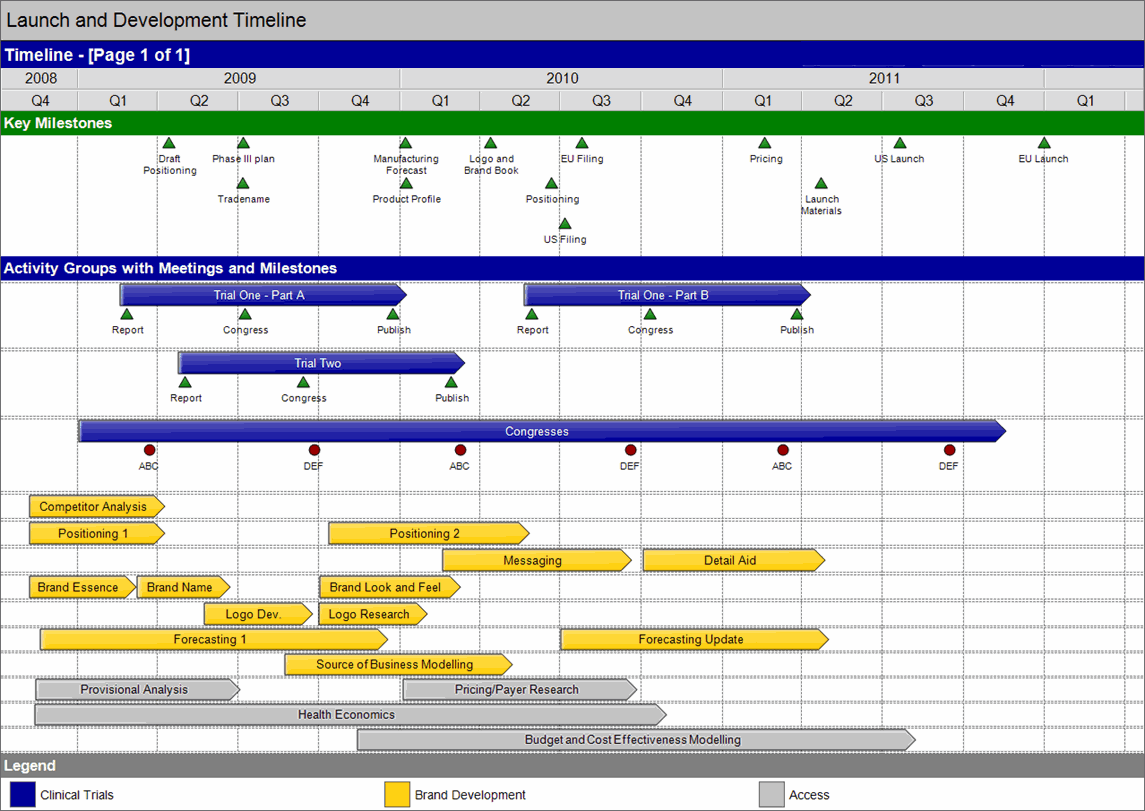
Swiftlight Timeline Examples

Click on the link to see a larger image of the above gantt chart / project timeline

Click on the link to see a larger image of the above gantt chart / project timeline

Click on the link to see a larger image of the above gantt chart / project timeline
With Swiftlight’s intuitive drag-and-drop interface and outstanding ease-of-use, you can get started and create great looking project timelines like these in minutes.
How to Create a Swiftlight Timeline in 3 Minutes ->
Sign Up for a FREE 30 Day Trial —>
In 1917, Henry Gantt developed the first basic Gantt charts, since when they have become very popular. Gantt charts are simply bar charts that depict project tasks against a calendar timeline and they are typically used for project planning and ongoing project management to help users understand timelines and project status.
Gantt charts typically have a format where tasks are laid out in a table, with dates running across the top, one task per row and horizontal bars representing the dates / duration of each task. Tasks may run sequentially, in parallel, or overlapping and may be linked to represent the inter-dependencies between tasks. Many software tools can capture additional information about tasks, such as the people assigned to them, costs, percentage (%) completed and so on … An example of typical Gantt chart is shown above.
A timeline is a more generic term for any graphic that depicts the timing of tasks (or something else) against a calendar. So a Gantt chart is a timeline, but not all timelines are Gantt charts!
Almost all projects wil require some sort of timeline. But whether you need a “Gantt chart” and the scheduling sophistication of typical project management software, or whether you just need a high level timeline and some more simple software, depends on you and the kinds of projects and initiatives you are involved with as illustrated in the graphic below:
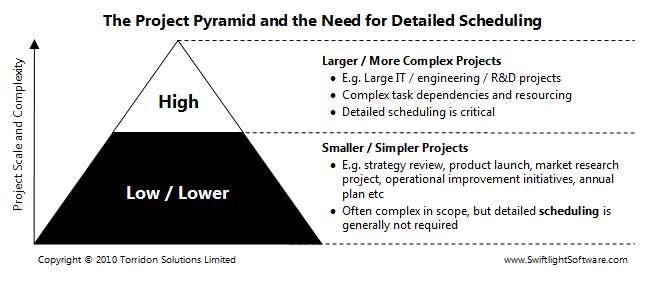
On large complex projects (e.g. in IT or engineering), there may be hundreds of tasks to keep track of and complex inter-dependencies. Here perhaps you will need a sophisticated software tool to build a Gantt chart to plan, schedule and keep track of all this detail. On many other projects though, you don’t face the same complexity and you’ll be better off looking for simpler software rather than using “a hammer to crack a nut”.
Swiftlight is primarily is designed more for the “smaller and less complex projects” lower down the pyramid shown above, and for the business managers and non-specialist project managers who run them. These kinds of projects typically have less complex scheduling needs, and the managers who run them often find traditional Gantt chart software, such as Microsoft Project, to be overly complex. Swiftlight on the other hand is well-suited for these projects and these users. It’s practical, visually appealing and offers outstanding ease-of-use:
Click here to Get Your Free 30 Day Swiftlight Trial
Note: while Swiftlight is not primarily targeting complex IT or engineering projects, it can still be a useful high level planning and communication tool alongside whatever sophisticated Gantt chart software is being used for detailed scheduling.
Unlike other project management programs such as Microsoft Project, Swiftlight does not burden you with complicated scheduling options, various types of dependencies and a cluttered interface. Don’t take our word for it.
PCWorld said: “Creating and tracking a project (in Swiftlight) is exceptionally easy because the interface is simple and clean”.
This means you can get started and create useful outputs quickly without training and without having to learn advanced project management terms and techniques. At around half the price of MS Project, Swiftlight offers an appealing combination of features and is great value when detailed Gantt charts and complex scheduling are more than you need.
See how easy to use Swiftlight is: watch this 3 minute video
Some projects require sophisticated software to create the detailed Gantt charts that help project managers list and schedule tasks, set up dependencies, assign resources and then to manage the plan over time. Microsoft Project is generally regarded as the market leader amongst the more sophisticated project management software tools.
When you do need these sophisticated Gantt chart software tools and the Gantt chart features they provides, Swiftlight can still help:
Learn more about Swiftlight’s links to / from MS Project.
Swiftlight’s powerful Timeline View provides an excellent alternative to the outputs provided by traditional Gantt chart software. It can provide a clear summary of project goals and deliverables, the duration of activities and the timing of key meetings and milestones, all on one page.
Swiftlight provides a variety of different displays, it’s easy to move items around, and it’s visually appealing with customizable colors, fonts and more. No other project management software offers this sophisticated combination of a high level planning structure, clear PowerPoint-like graphics and outstanding ease-of-use.
Download Your Risk-free 30 Day Trial Now!
Swiftlight makes it easy to create a project plan or timeline and then, because of its high quality visuals and one-click export to PowerPoint, to use these outputs for project communication and reporting. While traditional Gantt charts can be too detailed for project proposals or for meetings with senior executives, leading you to spend time creating new outputs in PowerPoint, Swiftlight is both a planning tool and communication tool, saving hours of your precious time. With Swiftlight you can:
| Create presentation-ready timelines in minutes | With an intuitive interface, WYSIWYG design and one-click export to MS PowerPoint, using Swiftlight is easy and fast – saving you time. |
| Visualise and communicate the “big picture” | With bold visuals and 8 different views, Swiftlight lets you separate the “big picture” from the detail – creating clarity for you and for others. |
| Focus on the fundamentals | With a focus on objectives, deliverables and measures of success, as well as a “to-do” list, Swiftlight gives you the fundamentals to get things done. |
| Implement more effectively | With clearer, easy to communicate plans, Swiftlight can improve team and management buy-in – providing you with clarity that leads to better results. |
| Get going quickly | Outstanding ease of use allows many people to use Swiftlight effectively with no training … it’s that easy. |
Whatever sort of project you are working on, Swiftlight is a Gantt chart software alternative that is well worth a look. For complex projects, Swiftlight can be a very useful high level planning and reporting tool alongside the Gantt chart software you will likely also need for detailed scheduling. For smaller, less complex projects, Swiftlight can be your core project planning and communication tool.